
Can terrestrial plants enable assessment of nutrient pressures in dry streams?
27 July, 2026
Oliver Longstaffe (1), Andrew Apanasionok (2), Chloe Hayes (2), Lesley Rippon (2)*, Simon Rouen (1), Romain Sarremejane (1) and Rachel Stubbington (1)*.
(1) Nottingham Trent University, Nottingham, UK; (2) Environment Agency, Bristol, UK.
*Corresponding authors: lesley.rippon@environment-agency.gov.uk; rachel.stubbington@ntu.ac.uk.
The authors, led by FBA Fellow Rachel Stubbington and her Environment Agency colleague Lesley Rippon, are collaborators working to develop health assessment methods for temporary streams. In this project, they assessed the potential of (largely) terrestrial plant communities as indicators of nutrient pressures in dry streams.
Introduction
Temporary streams, those which sometimes dry out, dominate global river networks, are becoming increasingly common due to human influences including climate change, and are widespread and diverse even in cool, wet countries including the UK (Fig. 1; Stubbington et al. 2017). Like other freshwaters, temporary streams are impacted by human pressures, with inputs from agricultural land causing widespread pollution by inorganic nutrients including nitrogen and phosphorus. However, methods to assess the ecological health of temporary streams during dry phases are lacking.
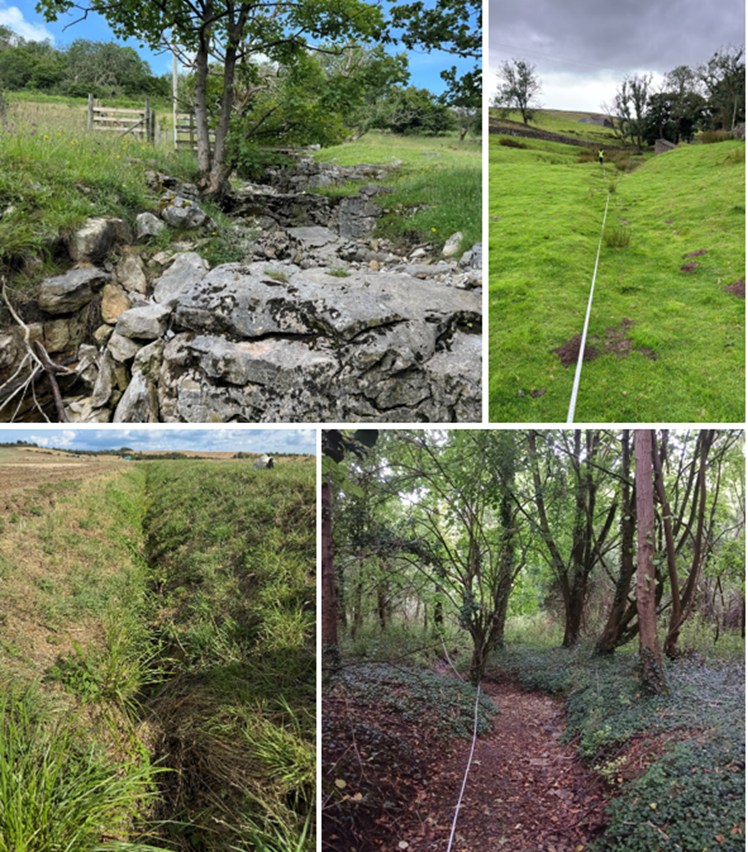
Figure 1. Survey sites, illustrating the diversity of England’s dry temporary streams.
Dry temporary stream channels support diverse plant communities, including drying-tolerant aquatic species and terrestrial species that colonise as water levels fall (Milner et al. 2023). Aquatic plants are well-established biomonitors of inorganic nutrient pressures in flowing waters (WFD-UKTAG 2014), and our previous research demonstrated associations between dry-phase communities and inorganic nutrient concentrations—but we only studied lowland chalk streams (Hayes 2022). Here, we developed Hayes’ (2022) method and tested its potential to assess nutrient pressures across the breadth of England’s temporary streams.
Field methods
We visited 111 sites known to experience seasonal dry phases, in July–September 2024— just after England’s wettest 18-month period ever recorded(!). As such, only 35 sites were dry. Sites spanned much of England and represented a range of altitudes (1.5–378, mean ± SD 86 ± 76 m.a.s.l), alkalinities (32–395, 198 ± 63 mg CaCO33 L-1), and ‘bad’ to ‘good’ ecological status classes (WFD-UK TAG 2014; Fig. 2).
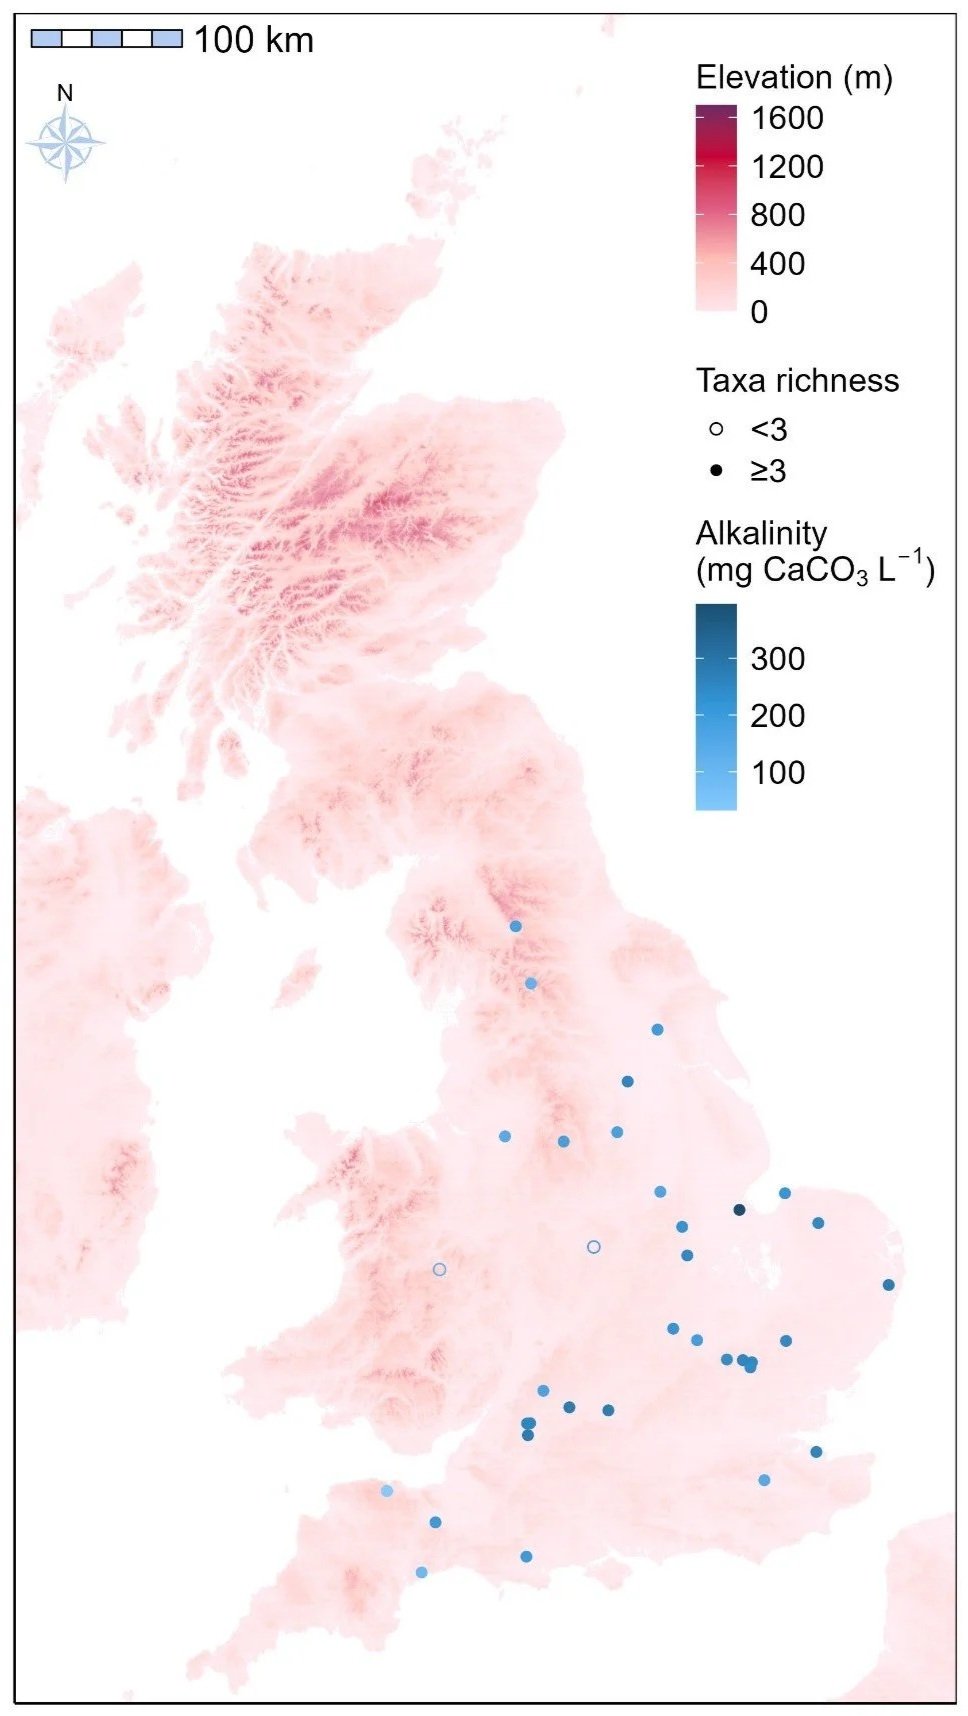
Figure 2. Survey site locations.
At each site, we surveyed a 100-m stretch, recording the identity and estimating the cover of all plants which would be submerged above median flows, as per the standard UK method in flowing rivers (WFD-UKTAG 2014). Most plants were identified to species, but some to a higher level where key features were missing. We recorded environmental variables including shading, sediment composition, land use and human pressures. We collected sediment samples and quantified sediment moisture content in the laboratory. Of these, shading and moisture warranted analysis (see below).
Data analysis
We used Environment Agency data describing site-specific nutrient concentrations in water samples collected in the preceding three years. Following preliminary analyses of 37 candidate predictor variables, we concentrated on three: the mean total nitrogen (TN) and the mean ratio of total phosphorus to soluble reactive phosphorus (TP:SRP). To represent total nutrient levels, we scaled TN and TP:SRP from 0–1 and summed them (TN+TP:SRP). We analysed these three nutrients alongside four core environmental predictor variables: alkalinity, altitude, moisture and shading.
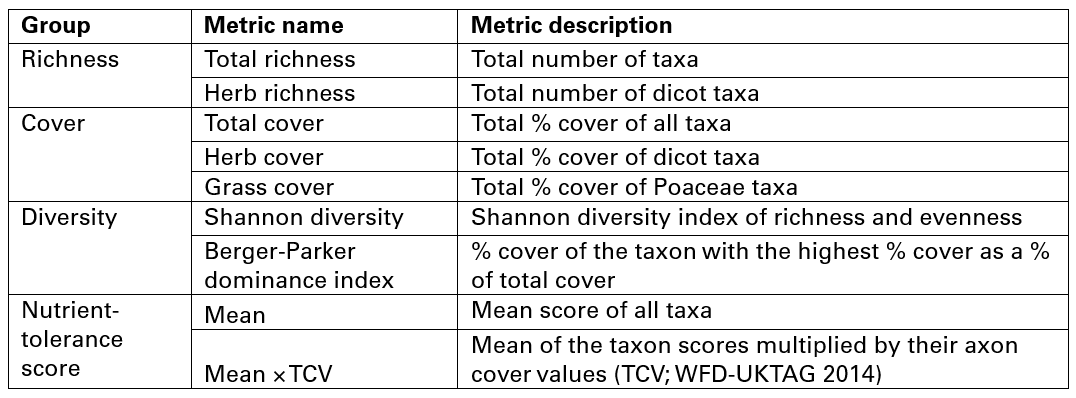
All taxa were included in the analysis except for terrestrial mosses, which we encountered only twice and which are hard to identify. Based on preliminary analyses of 19 candidate biotic metrics, we concentrated on nine (Table 1), including nutrient-tolerance scores based on Ellenberg N values (Hill et al. 1999) for terrestrial taxa and river macrophyte nutrient index scores (WFD-UKTAG 2014) for aquatic taxa.
Table 1. Biotic metrics calculated to represent plant communities.
We ran linear models to analyse associations between the nine biotic metrics and the three nutrient predictor predictors, and separately, the four core environmental predictors. We reran linear models with an interaction term to determine the influence of each core environmental predictors on nutrient–biota relationships. Based on preliminary analyses, we only included sites at which ≥3 taxa were recorded (Fig. 2). We considered p <0.05 and R2 >0.10 to indicate significant associations warranting consideration.
Results
Mean TN ranged from <1 mg L-1 at four sites to 18–23 mg L-1 at five sites, and mean TP from 0.01 mg L-1 at three sites to 1.1–1.2 mg L-1 at two sites, indicating sufficient variation in nutrient concentrations to warrant consideration of biotic responses. Many sites were exposed to human influences, with agriculture being the dominant land use at 28 of 35 sites.
In total, we recorded 101 plant taxa to at least genus, including 75 vascular terrestrial taxa (including 57 herbs and 10 grasses), 19 vascular aquatic taxa, five aquatic bryophytes and two aquatic algae. Considering the 33 surveys in which ≥3 taxa were recorded, total richness varied from 3–21 (mean ± SD 8.3 ± 5.1) taxa per survey, and cover ranged from 2.5–100% (30 ± 31%). Herbs contributed most to richness and grasses accounted for most cover. Mean site-specific nutrient-tolerance scores ranged between 4.2–7.5 (6.2 ± 0.73), where—based on Ellenberg N scores—scores of 5–7 indicate intermediate to richly fertile sites (Hill et al. 1999).
Of the nine biotic metrics, only the mean nutrient-tolerance score had a significant, positive association with TN (p <0.001, R2 = 0.552; Fig. 3a) and this was not altered by alkalinity, altitude, moisture or shading. Five metrics had significant associations with mean TP:SRP, in particular a positive association of the mean × TCV nutrient-tolerance score (p = 0.001, R2 = 0.273; Fig. 3b), which was not altered by interactions with any core environmental predictor. Accordingly, the strongest, most significant, non-interacting associations with mean total nutrient levels (as TN+TP:SRP) were for the mean nutrient-tolerance score (p <0.001, R2 = 0.467; Fig. 3c), followed by the mean × TCV nutrient-tolerance score (p = 0.007, R2 = 0.189). Total richness also had some significant, negative associations with some nutrients following removal of an outlier (e.g. p = 0.037, R2 = 0.109; Fig. 3d)—but richness declined as shading increased (p = 0.008, R2 = 0.176).
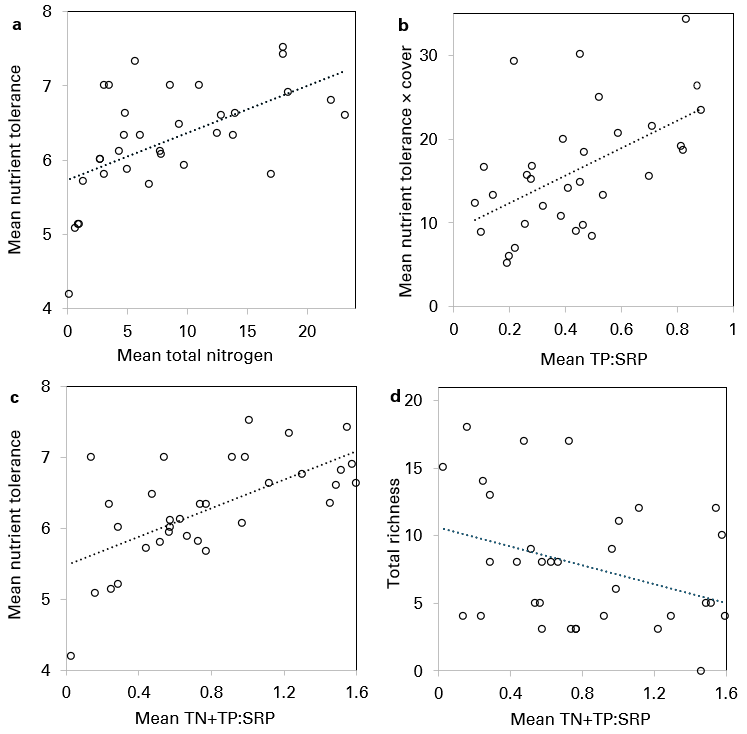
Figure 3. Associations between inorganic nutrients and biotic metrics representing dry-phase plant communities. Points represent sites.
Discussion
Our results demonstrate that the largely terrestrial plant communities present in dry stream channels have high potential as bioindicators of inorganic nutrient pressures affecting temporary streams. We suggest that the mean nutrient-tolerance score and mean × TCV nutrient-tolerance score have the highest potential to characterise dry-phase plant community responses to nutrient pressures. Despite their relatedness, these two nutrient-tolerance scores were not correlated (data not shown). In addition, taxonomic richness was informative—and provides a vital measure of confidence in other metrics, including nutrient-tolerance scores. These three metrics thus have particular, collective potential to indicate nutrient pressures.
However, until relationships between natural variability in nutrient concentrations and dry-phase plant communities (e.g. type-specific ‘reference’ conditions), and human-caused alteration of these relationships (e.g. boundaries between ecological status classes, sensu WFD-UKTAG 2014) are established, survey data can only indicate community associations with nutrient availability, not nutrient pressures or ecological status. The mechanistic relationships underlying observed associations also require characterisation.
Other study limitations include poorer representation of upland than lowland sites: further work is needed to characterise metric performance across environmental gradients including alkalinity and altitude. In particular, although not significant for the reported associations, nutrient-tolerance scores were less informative at higher alkalinities, possibly because phosphorus—the limiting nutrient in freshwaters—is more bioavailable in alkaline waters. In addition, richness declined as shading increased, and basing conclusions on too few taxa could confound nutrient pressure assessments. Addressing these issues will facilitate progress towards enabling assessment of nutrient pressures—in both wet and dry streams.
Acknowledgments
Funded by the UK Government through Defra’s Natural Capital and Ecosystem Assessment programme.

The authors thank Martyn Kelly for constructive feedback that improved earlier versions of the article.
References
Hayes, C., 2022. Ecological responses to environmental variability in wet and dry chalk streams. PhD thesis. Nottingham Trent University. Available here.
Hill, M.O. et al. 1999. Ellenberg's indicator values for British plants. ECOFACT volume 2 technical annex. Institute of Terrestrial Ecology. Available via https:/nora.nerc.ac.uk/id/eprint/6411/.
Milner, V.S., Dutton, J.S. and Hayes, C., 2023. Colonisation of terrestrial vegetation in an intermittent river: Diversity responses to seasonal drying. River Research and Applications 39: 703–717. https://doi.org/10.1002/rra.4085.
Stubbington, R. et al. 2017. Temporary streams in temperate zones: recognizing, monitoring and restoring transitional aquatic‐terrestrial ecosystems. Wiley Interdisciplinary Reviews: Water 4: e1223. https://doi.org/10.1002/wat2.1223.
WFD-UKTAG (Water Framework Directive – United Kingdom Technical Advisory Group), 2014. UKTAG river assessment method: macrophytes and phytobenthos: macrophytes (river LEAFPACS2). Available here.
Further FBA reading
The Freshwater Biological Association publishes a wide range of books and offers a number of courses throughout the year. Check out our shop here.







Get involved
Our scientific research builds a community of action, bringing people and organisations together to deliver the urgent action needed to protect freshwaters. Join us in protecting freshwater environments now and for the future.

NEW COURSE: Pond Restoration Training: North West England on 6 & 7 July 2026. From £250.00
Ponds are increasingly recognised as critical features for biodiversity conservation across UK landscapes. This two-day course will introduce participants to the science and best practice of pond restoration.
Helen Greaves of the Pond Restoration Research Group at University College London (UCL) is a co-founder of the Norfolk Ponds Project (NPP) and Executive Director of the NPP Community Interest Company (CIC). With over 15 years’ experience restoring ponds and researching their ecological recovery, and following publication of the recent Guide to the Restoration, Creation and Management of Ponds, Helen is keen to share key lessons and practical insights from both the UCL and NPP teams.
The course will include a combination of lectures, workshops, and field visits focused on the restoration of degraded overgrown ponds and in-filled “ghost ponds”.
Participants will be introduced to the scientific evidence underpinning pond restoration, including the benefits for freshwater and terrestrial biodiversity. The course will also cover the key DOs and DON’Ts of restoration, including pond selection and important considerations during the restoration process.
Field visits will explore two contrasting pond landscapes typical of West Lancashire. One site is situated within a lowland floodplain landscape, while the other lies within a higher arable setting adjacent to a nature reserve. These visits will provide an opportunity to compare ponds across different land uses, including farmland and conservation-focused landscapes. Participants will consider how landscape context influences restoration potential, management approaches, and ecological outcomes, including the specific challenges and opportunities associated with restoring existing ponds and resurrecting ghost ponds.
The course will also address approaches to engaging landowners, farmers, and local communities in pond conservation, alongside practical routes for securing funding to support restoration work.
Participants on all FBA courses must be 18 years and above.
Location: West Lancashire (near Ormskirk)
Tutor: Helen Greaves
Price: £275 for non-members, £250 for members
Please click on the following link to download and complete the booking form then email to info@fba.org.uk: FBA Courses Booking Form.docx
TO AVOID POSTAL CHARGES PLEASE SELECT ‘PICK UP’ OPTION AT CHECKOUT.
Please note: Payment must be made in full via the website in order to secure your place on this course.