
Big Windermere Survey Maps
The Big Windermere Survey (BWS) is an innovative and impactful citizen science project designed to assess the environmental health of Windermere, a vital and iconic body of water within the Lake District National Park and UNESCO World Heritage site.
The project was first developed in 2022 through collaboration between the Freshwater Biological Association (FBA) and Lancaster University, in response to community concern around water quality and gaps in traditional water quality monitoring.
Like many freshwaters, Windermere experiences multiple pressures that can influence its condition, including nutrient enrichment, invasive non-native species, impacts from people living in or visiting the catchment, and climate change. In this context, the goals of the BWS are to provide new data and understanding of bacterial and chemical water quality around Windermere, and within rivers and other lakes in the wider Leven catchment, whilst also engaging local communities in understanding and helping to protect these precious freshwaters.
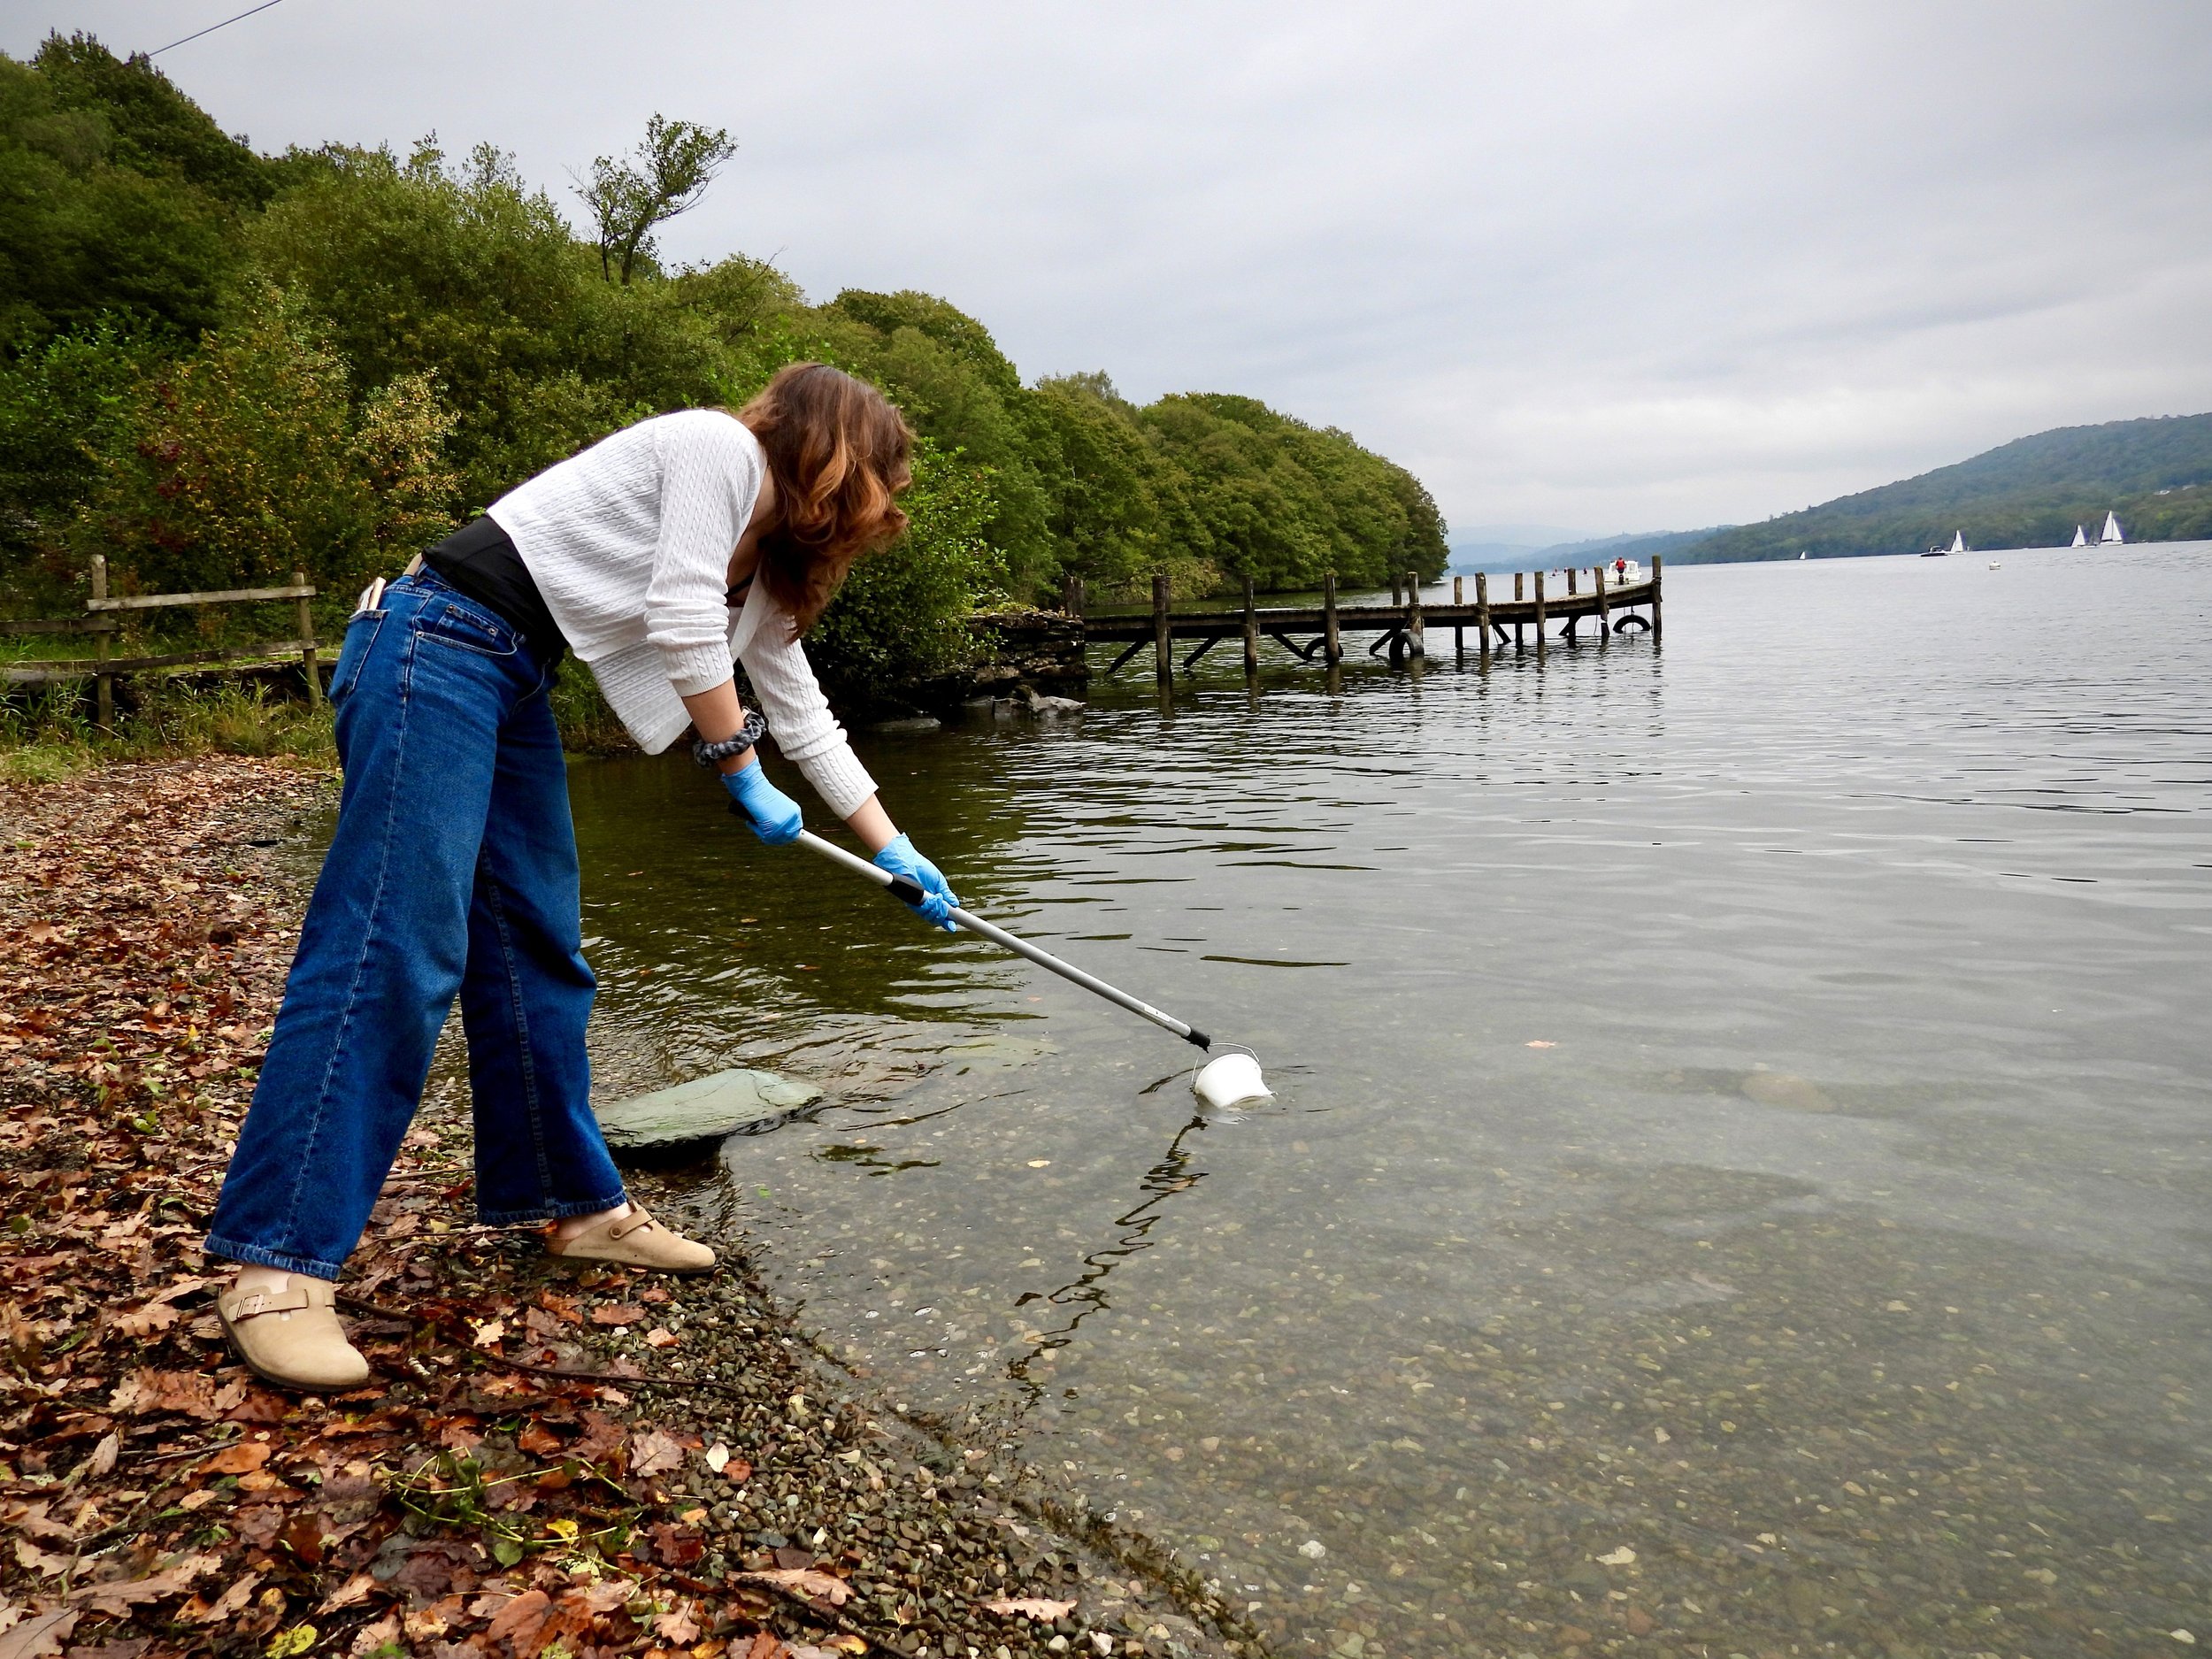
Ten surveys have been conducted seasonally (spring, summer, autumn and winter) over two and a half years between June 2022 and November 2024. During a two-hour window in each survey, dedicated citizen scientists collect water samples from over 100 locations in the Leven catchment.
Below are details of bacterial spatial patterns with supporting interactive maps, and phosphorus spatial patterns with supporting interactive map.
For more information please download the Big Windermere Survey two year report, June 2022 - November 2024, below.
BACTERIAL SPATIAL PATTERNS
The BWS uses data from 71 sample sites around Windermere’s entire shoreline to provide unique information about how the concentration of bacteria varies. Intestinal enterococci (IE) and Escherichiacoli (E. coli) are two types of bacteria found in the digestive systems of humans and animals. If people ingest these bacteria in sufficient quantities, for example by swallowing contaminated water during swimming, this can result in illnesses such as stomach upsets.
The two maps (below) report median (the middle value when data are sorted from low to high) concentrations of IE and E.coli for each Windermere shoreline site, based on all samples collected by the BWS citizen scientists since the project began in June 2022. Concentrations of IE and E.coli are highly positively correlated, suggesting common sources and behaviour for these two groups of bacteria at individual sample sites within Windermere.
The data reveal areas of higher bacteria concentrations: around Waterhead (L003), High and Low Wray Bays (L068, L071),White Cross Bay (L009), Rayrigg Wyke (L017), and Millerground (L015) in the north of Windermere; within Bowness Bay (L019), around Harrow Slack (L060) and Cockshott Point (L020) in the centre of Windermere; around the inflows of Cunsey (L051) and Wilfin Becks (L054) on the south-western shore; and at the very southern end of Windermere towards the outflow to the River Leven (L041 and L042).
Of these noteworthy areas, maximum median concentrations of bacteria were observed at sample sites within Bowness Bay, reaching over five times (E.coli) and seven times (intestinal enterococci) the median concentration for all sites taken across the whole of Windermere.
BACTERIAL SPATIAL MAPS
Click on the interactive maps below to download & open in a new browser
E. COLI

INTESTINAL ENTEROCOCCI

PHOSPHORUS SPATIAL PATTERNS
The TP concentrations map (below) illustrates median Total Phosphorus (TP) concentrations at each of the 71 sites around Windermere’s shoreline, based on all samples collected during the BWS.
The data provide unique information about how TP concentrations vary around the lake, including at many sites that have never previously been analysed for water quality. The results highlight key locations at which elevated TP concentrations were observed, among the top 15 of which are:
Lakeside (L042), at the southern end of Windermere.
Sites along the upper south-western shoreline, near to: Matson Shoal (L055), High Cunsey (L054), Ling Holme Island (L051), and along the lake road towards Graythwaite (L049).
Central areas: Bowness promenade (L018), Mitchell Wyke Bay (L057), Rayrigg Wyke (L017), Windermere Marina (L022) and sites on the western shore near Belle Isle (L060 & L063).
Millerground (L015) on the north-east shore.
Waterhead (L003) at the northern end of the lake.
When stepping back to consider the lake basins, the south-east shows significantly lower median TP than both the north-east and south-west, suggesting regional differences in phosphorus loading.
PHOSPHORUS SPATIAL MAP
Click on the interactive map below to download & open in a new browser
TP CONCENTRATIONS

Which phosphorus concentrations are used in lakes and rivers?
Phosphorus occurs in many forms in water, it may be dissolved in water, part of organic matter like algae cells, or attached to sediment. Total phosphorus (TP) includes all of these forms. In lakes like Windermere, TP concentration is compared to the Water Framework Directive (WFD) standards to give a classification that varies from High to Bad as total phosphorus concentrations increase.
However, for samples collected from streams and rivers in the BWS, we focus on Soluble Reactive Phosphorus (SRP). This is the dissolved forms of phosphorus within a water sample, which are immediately available to organisms living in water, such as plants and algae. Because SRP excludes phosphorus attached to organic matter or sediment, its concentration will always be lower than TP. The WFD gives separate SRP standards for rivers and streams, though they also enable river and stream sites to be classified from High to Bad, as SRP concentrations increase.
The Big Windermere Survey Report
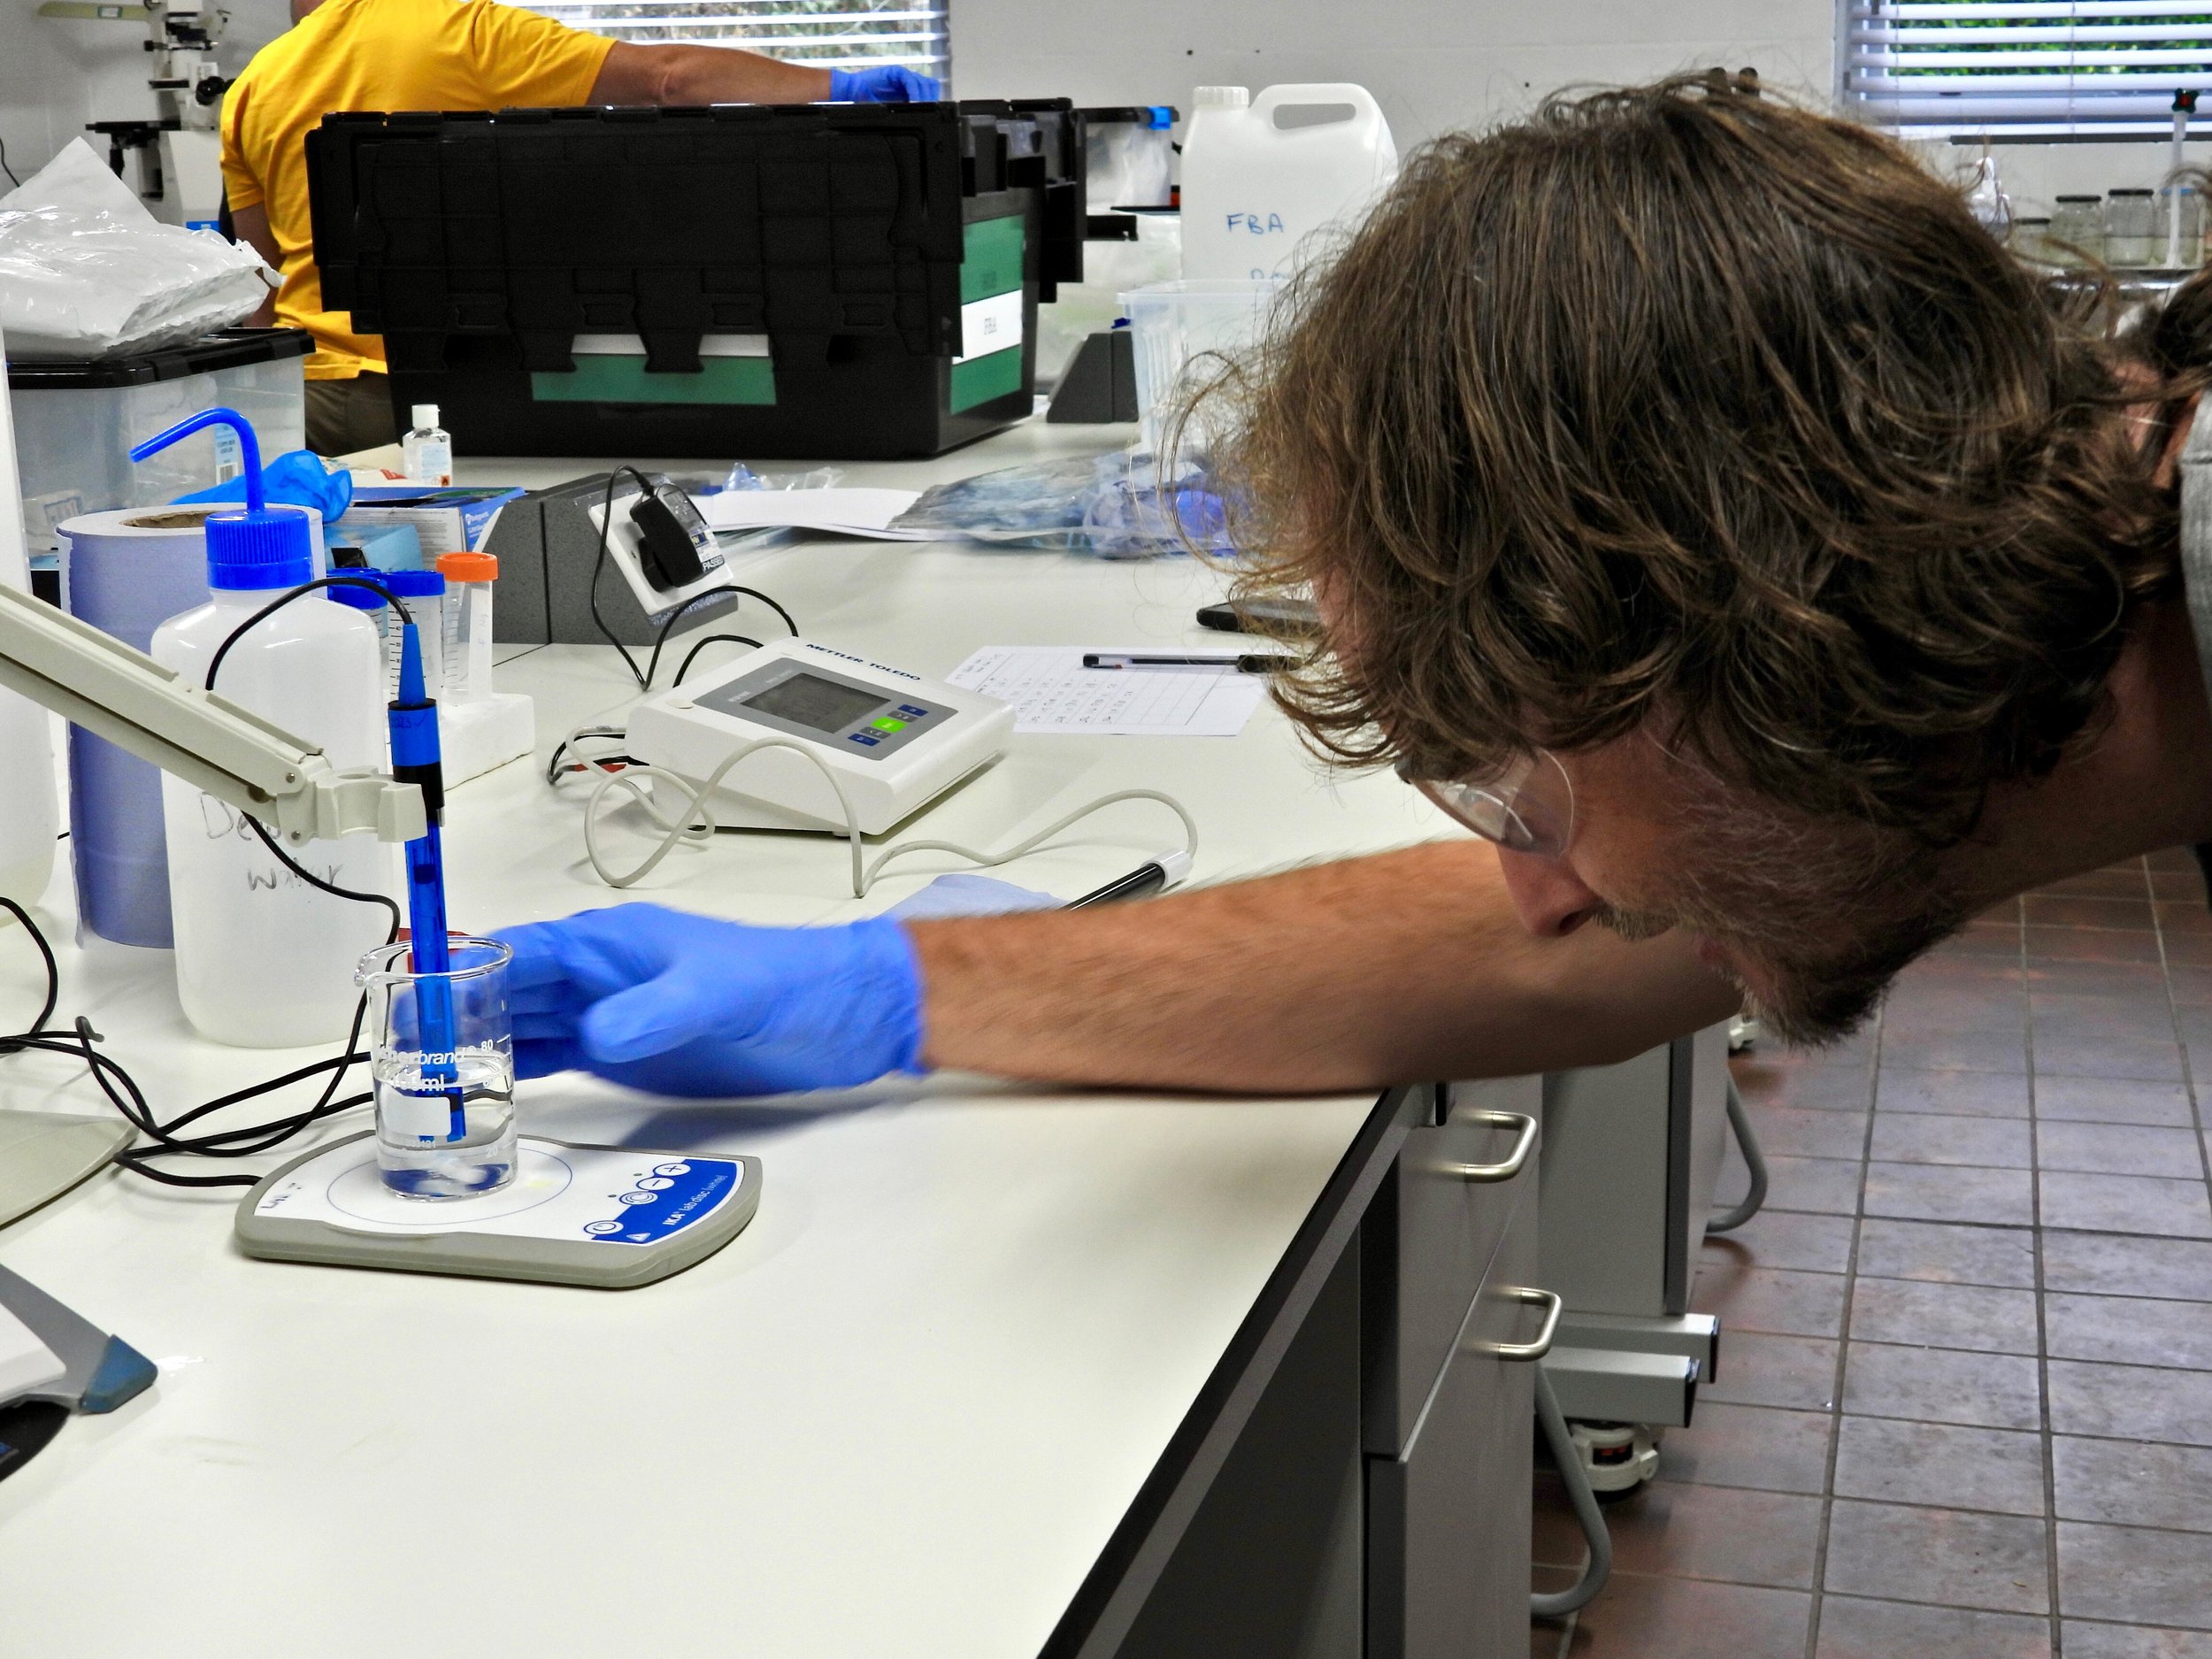
The Big Windermere Survey is a unique collaboration between members of the community and professional scientists at Lancaster University and the Freshwater Biological Association. This collaboration has created unprecedented evidence describing Windermere’s water quality, built on robust scientific data collected from over 100 locations around Windermere’s shoreline and the wider Leven catchment.
The Big Windermere Survey (BWS) report, covering the period June 2022 to November 2024, is a summary of the most spatially detailed, scientific water quality dataset for the lake, and demands action to address ‘Poor’ water quality results.
Thank you to all our wonderful citizen scientists and funders for supporting the Big Windermere Survey!
Find out more about the Big Windermere Survey
-

About the Big Windermere Survey
The BWS was launched by the FBA and Lancaster University in 2022 to help assess the environmental health of Windermere.
-
Importance of Citizen Science
Here at the FBA we value the power of Citizen Science to support the conservation of freshwater environments.
-
BWS Results
Explore the results from our previous surveys and view all data on our interactive Cartographer map.
Support the Big Windermere Survey
The Big Windermere Survey is a vital community based project which would not be possible without funding. Please consider donating today.